$115,000 a Year After Tax in Indiana
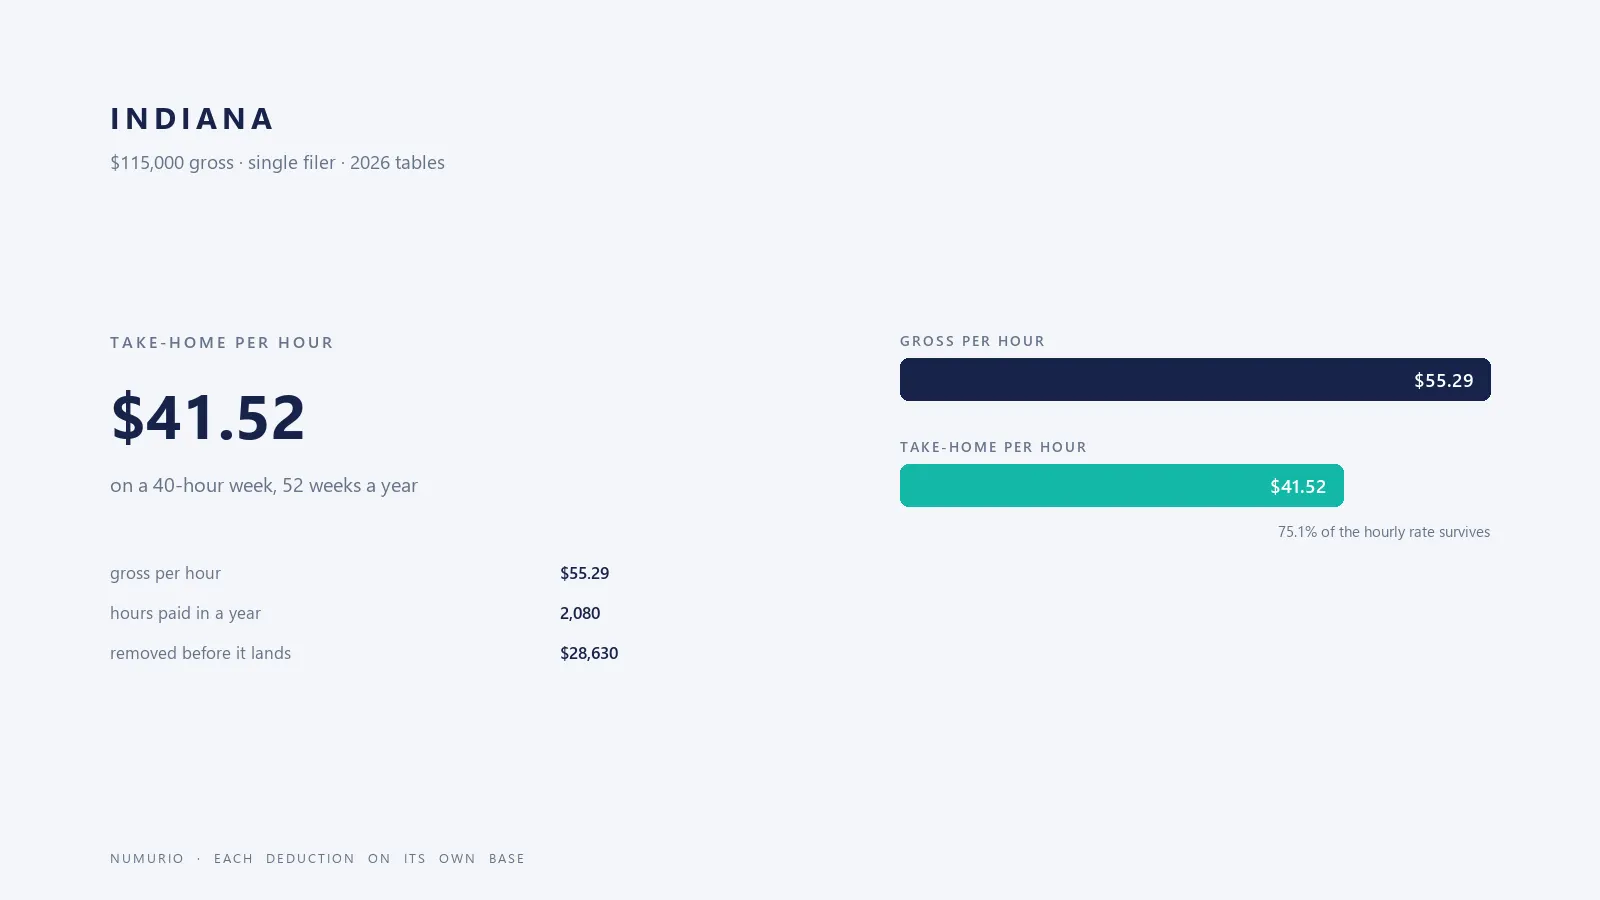
A single filer earning $115,000 in Indiana takes home about $7,197 a month, or $86,370 a year, after federal income tax, FICA and state tax. Change the filing status, add a 401(k) or HSA, or name a city, and the figure below moves with you.
Adjust it to your situation
| Line item | Annual | Monthly |
|---|---|---|
| Gross pay | $115,000 | $9,583 |
| Pre-tax deductions (401k / HSA) | -$0 | -$0 |
| Federal income tax | -$16,470 | -$1,373 |
| Social Security | -$7,130 | -$594 |
| Medicare | -$1,668 | -$139 |
| Indiana state income tax | -$3,363 | -$280 |
| Take-home pay | $86,370 | $7,197 |
- Federal income tax$16,47014.3%
- FICA (Social Security + Medicare)$8,7987.6%
- Indiana income tax$3,3632.9%
- Take-home pay$86,37075.1%
Where the $115,000 goes before it reaches your account
The gap between gross and net is built from three separations, and they are not the same kind of calculation. The federal piece is banded: every band of taxable income carries its own rate, so no single percentage describes the whole salary. Social Security charges 6.2% until the wage base and stops; Medicare charges 1.45% on every dollar past it. The last separation belongs to Indiana.
Indiana applies a flat rate on top, so the same salary in a neighbouring state can land thousands of dollars apart over a year.
These figures assume a single filer, the standard deduction and no pre-tax entries. Indiana's statewide schedule is modelled in full; the city and county add-ons that some localities levy are not in the dataset, so a resident of one of those places will see a lower figure on the cheque.
Every line of the calculation
Nothing is hidden in the arithmetic: this is the list the calculator returned, unchanged, at the defaults above. Every line is a base times a rate, and every rate is in the source list.
| Line | Annual | Monthly (12) | Semi-monthly (24) | Bi-weekly (26) | Weekly (52) |
|---|---|---|---|---|---|
| Gross pay | $115,000 | $9,583 | $4,792 | $4,423 | $2,212 |
| Pre-tax deductions (401k / HSA) | -$0 | -$0 | -$0 | -$0 | -$0 |
| Federal income tax | -$16,470 | -$1,373 | -$686 | -$633 | -$317 |
| Social Security | -$7,130 | -$594 | -$297 | -$274 | -$137 |
| Medicare | -$1,668 | -$139 | -$69 | -$64 | -$32 |
| Indiana state income tax | -$3,363 | -$280 | -$140 | -$129 | -$65 |
| Take-home pay | $86,370 | $7,197 | $3,599 | $3,322 | $1,661 |
Monthly, semi-monthly, bi-weekly and weekly columns are the annual amount divided by 12, 24, 26 and 52. Those are averages, not a payroll formula. A payroll system runs the IRS percentage method on every cheque, which is why a bonus month can withhold above this average and settle up at filing. Past the Social Security wage base the 6.2% stops, and the cheques after that point come out higher.
Married, filing jointly, on the same salary
The table above is one person's return throughout. If this $115,000 is the household's only income and the couple files jointly, the standard deduction doubles and each federal bracket covers twice the income before the next rate begins, so the same gross salary keeps $7,060 more a year. Most of the gap comes from the federal side; some states widen their own brackets for joint filers too, which is why this is computed from the real Indiana table rather than assumed.
| Pay period | Single filer | Married, filing jointly | Difference |
|---|---|---|---|
| Annual | $86,370 | $93,429 | $7,060 |
| Monthly (12) | $7,197 | $7,786 | $588 |
| Bi-weekly (26) | $3,322 | $3,593 | $272 |
The comparison holds for a single earner. Split the same money between two people and each employer withholds against its own employee, so the household can end up in a bracket neither payslip shows on its own. Put both incomes into the calculator first.
$115,000 against the federal table, FICA and the state schedule
$98,900 of this salary clears the $16,100 standard deduction, and that is the federal base. The 22.0% band opens at $50,400, so the last dollar still lands inside it. The 24.0% band opens at $105,700 of taxable income, $6,800 away, or $6,800 in gross pay, and only income past that line would carry the higher rate.
FICA behaves the same at every salary below $184,500: 6.2% for Social Security plus 1.45% for Medicare, 7.65% in total, flat and with no brackets. This salary sits $69,500 below the Social Security wage base, so the full rate still applies to your next dollar, and only the portion above $184,500 would escape the 6.2% part.
| Position | Value here | Where it comes from |
|---|---|---|
| Federal taxable income | $98,900 | Gross $115,000 minus the $16,100 standard deduction |
| Federal bracket at the last dollar | 22.0% from $50,400 | $6,800 more gross pay to reach 24.0% |
| FICA on the next dollar | 7.65% full rate | $69,500 below the $184,500 wage base |
| State tax in Indiana | $3,363 at 2.9% marginal | $114,000 of state taxable income |
| Salary against the Indiana median wage | 2.6× | Median wage $44,095 · median household $71,959 |
Indiana charges a flat 2.9% on taxable wage income. Flat means the rate does not rise with the salary, but the base does: $114,000 of this salary is taxable after the state standard deduction, and the state line comes to $3,363 a year. Every additional dollar of taxable income costs 2.9% at the margin, the same as the first dollar.
Leave the tax tables for a moment and set the salary against the state itself: the median wage in Indiana is $44,095, so $115,000 is 2.6× the typical wage there. The median household there brings in $71,959, and that is a household total. One salary against a two-income median understates where this payslip sits.
Where the joint-filing gap comes from at $115,000
Married filing jointly on this one salary keeps $7,060 more a year than a single filer, $588 a month or $272 a cheque. $7,030 of it comes from the federal schedule, whose standard deduction and band widths both double.
Indiana adds $30 through its own schedule for joint filers. FICA contributes nothing either: $8,798 is the same for one filer and for a married couple on the same wages, since neither the wage base nor the Medicare rate depends on filing status.
Which Indiana brackets $115,000 actually touches
Indiana tax is charged on $114,000 of taxable income, which is gross pay minus the state standard deduction and the personal exemption. Only the slice inside each band is taxed at that band's rate; nothing is taxed at the top rate in full.
| Band | Rate | Income in this band | Tax from this band |
|---|---|---|---|
| $0 – up | 2.9% | $114,000 | $3,363 |
| Total | 2.9% marginal | $114,000 | $3,363 |
What makes Indiana different from a generic calculator
Indiana taxes wage income at a single 2.95% across every dollar. By top rate, this state ranks 39th of the 42 taxing jurisdictions compared here. Local income taxes levied by counties, cities or school districts add roughly 0.35% of income on average, and this figure leaves them out.
Questions this page answers
- How much is $115,000 a year after tax in Indiana?
- A single filer with no pre-tax contributions takes home about $86,370 a year, or $7,197 a month, in Indiana. Total withholding is $28,631, an effective rate of 24.9% on gross pay.
- What marginal rate applies at $115,000 in Indiana?
- At $115,000 the last dollar is taxed at 22.0% federally and 2.9% by Indiana, plus 7.65% FICA, or 32.6% combined. {effectiveRateNote(seed, formatPct(single.effectiveRate))}
- How much does a 401(k) contribution change take-home at $115,000?
- Deferring $24,500 cuts this year's withholding by $6,113 at this salary: federal and Indiana income tax fall, while FICA does not, because 401(k) deferrals sit outside the Social Security and Medicare base. Take-home falls by $18,387, and the $24,500 lands in the plan instead.
- How much is $115,000 a year bi-weekly after tax in Indiana?
- Across 26 pay periods a single filer takes home about $3,322 per bi-weekly cheque, or $1,661 if you are paid weekly. On a joint return with no other income, the same salary works out at about $3,593 per cheque. These are annual figures divided by the number of periods, not an employer's per-cheque formula.
- Which costs does the $115,000 figure not include?
- Itemising, credits past the standard deduction, a second job, and local taxes the selector does not cover. It further assumes twelve months at this rate with no bonus, no vesting and no unpaid leave; a real payslip at the same annual rate usually lands elsewhere.
Every assumption behind this figure, and the order the deductions are applied in, is on the methodology page.
Same salary, no state income tax
Run $115,000 through the same federal table in a state that does not tax wages and only one line changes, or disappears. Where the cards below match, the state takes nothing from the cheque; where they do not, a state-run payroll programme is the reason.
At this salary Indiana leaves $86,370 a year, while Texas, which has no state income tax at all, leaves $89,733, a difference of $3,363 created by the state income tax line and nothing else.
Every salary from $25,000 to $250,000 has a page of its own in Indiana. The full list is on the Indiana index.
Other salaries in Indiana
The same figure, three other entry points
Gross pay is the entry point here. Two neighbouring questions run the same arithmetic from the other end: what this amount nets as a 1099 contractor, where self-employment tax replaces the employee's half of FICA, and what gross clears a stated monthly net.
Where these federal figures come from
5 documents carry the federal side of this page. The brackets and the standard deduction come from the IRS annual inflation notice, the Social Security wage base from the SSA, and the 401(k) deferral limit from the IRS contribution-limit notice. Each link below is the document the dataset was read from for tax year 2026.
- IRS IR-2025-103 / Rev. Proc. 2025-32: 2026 federal brackets and standard deduction
- SSA: 2026 Social Security wage base of $184,500
- IRS: 2026 401(k) elective deferral limit of $24,500
- Tax Foundation: State Individual Income Tax Rates and Brackets, 2026
- Illinois Department of Revenue: IL-700-T 2026 withholding booklet (4.95%, $2,925 exemption)
Dataset status VERIFIED · reviewed 2026-11-07. The full cross-market list lives on the sources page; the computation chain is on the methodology page.