How much you need to earn to take home what you want
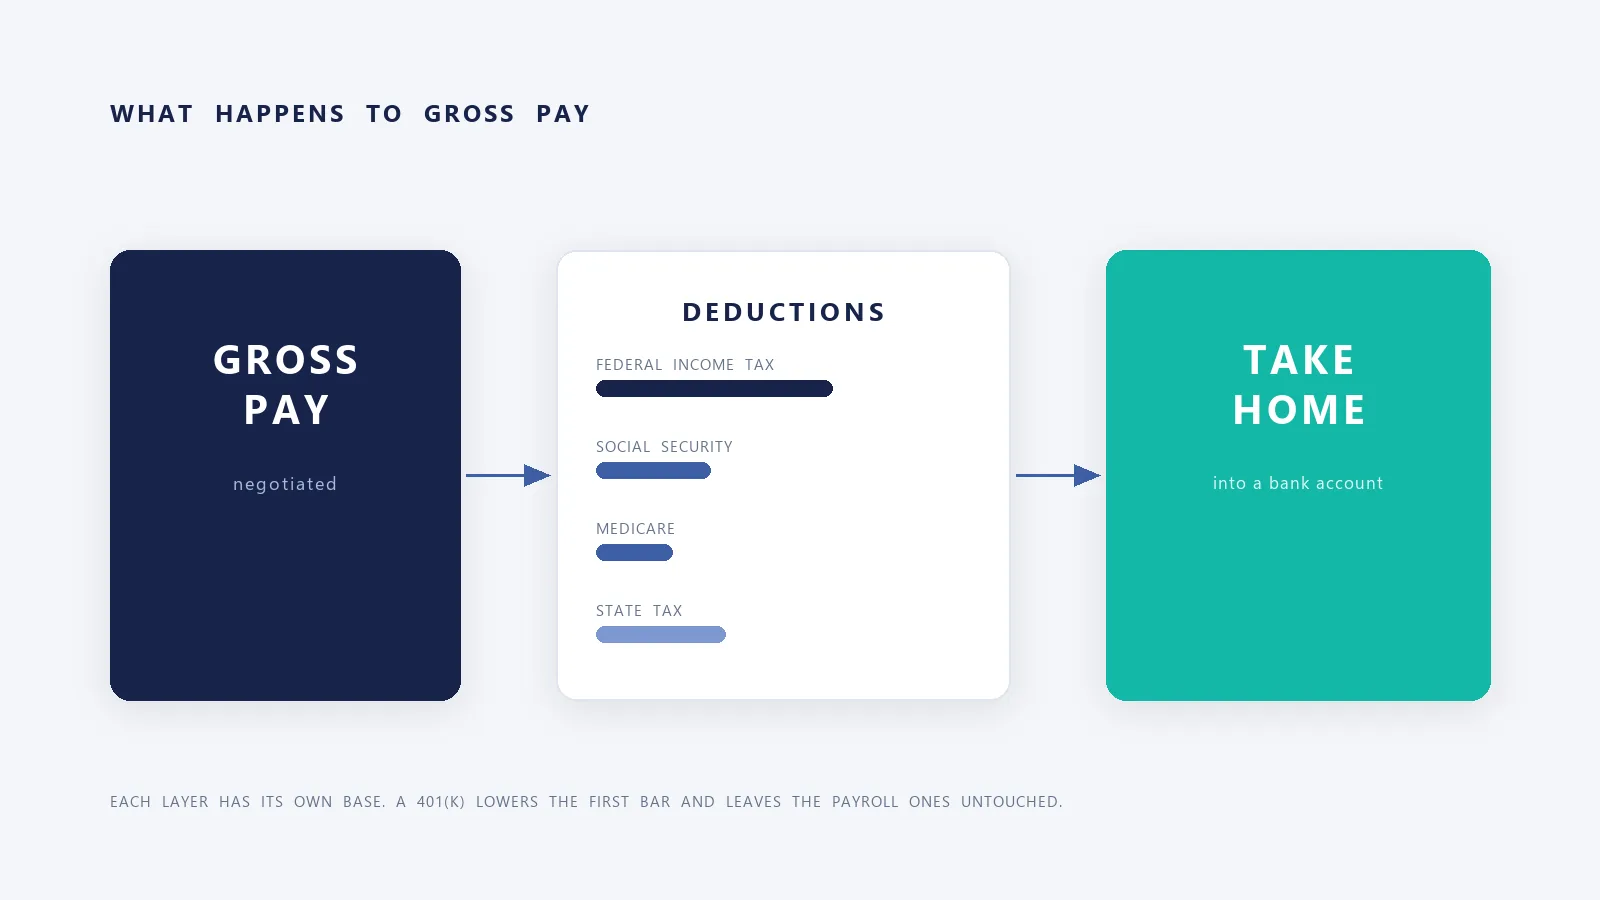
Most calculators start from gross pay and stop at net. Offers are negotiated the other way round: you know the number that has to land in your account each month, and the question is what salary gets you there. This table answers it directly for all 51 jurisdictions, at six monthly targets from $3,000 to $10,000.
Every figure is solved against the same engine that produces the $X-a-year pages — federal brackets, FICA including the Social Security wage base, and each state's own schedule with its standard deduction and credits. Nothing here is a lookup table copied from another site.
Monthly take-home target → gross salary required
Tax year 2026. Single filer, standard deduction, no 401(k) or HSA contributions, no city tax. Salary rounded to the nearest $50 so the take-home never falls short of the target. Click any figure for the full deduction stack at that salary.
Seven columns run past a phone screen — scroll sideways for the other targets.
Why the same target needs a different salary in each state
The federal layers are identical everywhere: the same standard deduction, the same brackets, the same 6.2% Social Security up to the wage base and 1.45% Medicare with no cap. Everything that moves between rows of this table is the state line. A state with no income tax needs the least gross pay to hit the same monthly net; a state with a steep progressive schedule plus a payroll levy needs the most, and the gap widens as the target rises.
Two mechanical details explain most of the difference. First, moving from $3,000 to $10,000 a month does not scale the salary linearly, because each extra dollar can be taxed at a higher marginal rate than the last — the required salary grows faster than the target. Second, Social Security stops at the annual wage base, so above that point the take-home rate jumps and the required salary rises more slowly than a straight-line projection would suggest.
What this table does not model
A real offer is rarely a clean salary. Bonuses are withheld at a flat supplemental rate, RSU vesting is withheld at vest rather than spread across the year, and a mid-year raise changes the withholding on every remaining cheque — all of which even out at filing time but make an individual payslip differ from an annual average. This table is the annual-average answer, which is what you need when comparing offers, not what you need to predict one cheque.
Married couples filing jointly keep more at the same gross, so the salary required to hit a given household take-home is lower than this table shows for single filers. Use the joint filing pages for that, or the live calculator to set filing status, city and pre-tax contributions yourself.
Where these federal figures come from
5 documents carry the federal side of this page. The brackets and the standard deduction come from the IRS annual inflation notice, the Social Security wage base from the SSA, and the 401(k) deferral limit from the IRS contribution-limit notice. Each link below is the document the dataset was read from for tax year 2026.
- IRS IR-2025-103 / Rev. Proc. 2025-32: 2026 federal brackets and standard deduction
- SSA: 2026 Social Security wage base of $184,500
- IRS: 2026 401(k) elective deferral limit of $24,500
- Tax Foundation: State Individual Income Tax Rates and Brackets, 2026
- Illinois Department of Revenue: IL-700-T 2026 withholding booklet (4.95%, $2,925 exemption)
Dataset status VERIFIED · reviewed 2026-11-07. The full cross-market list lives on the sources page; the computation chain is on the methodology page.