$95,000 after tax in Ontario, 2026
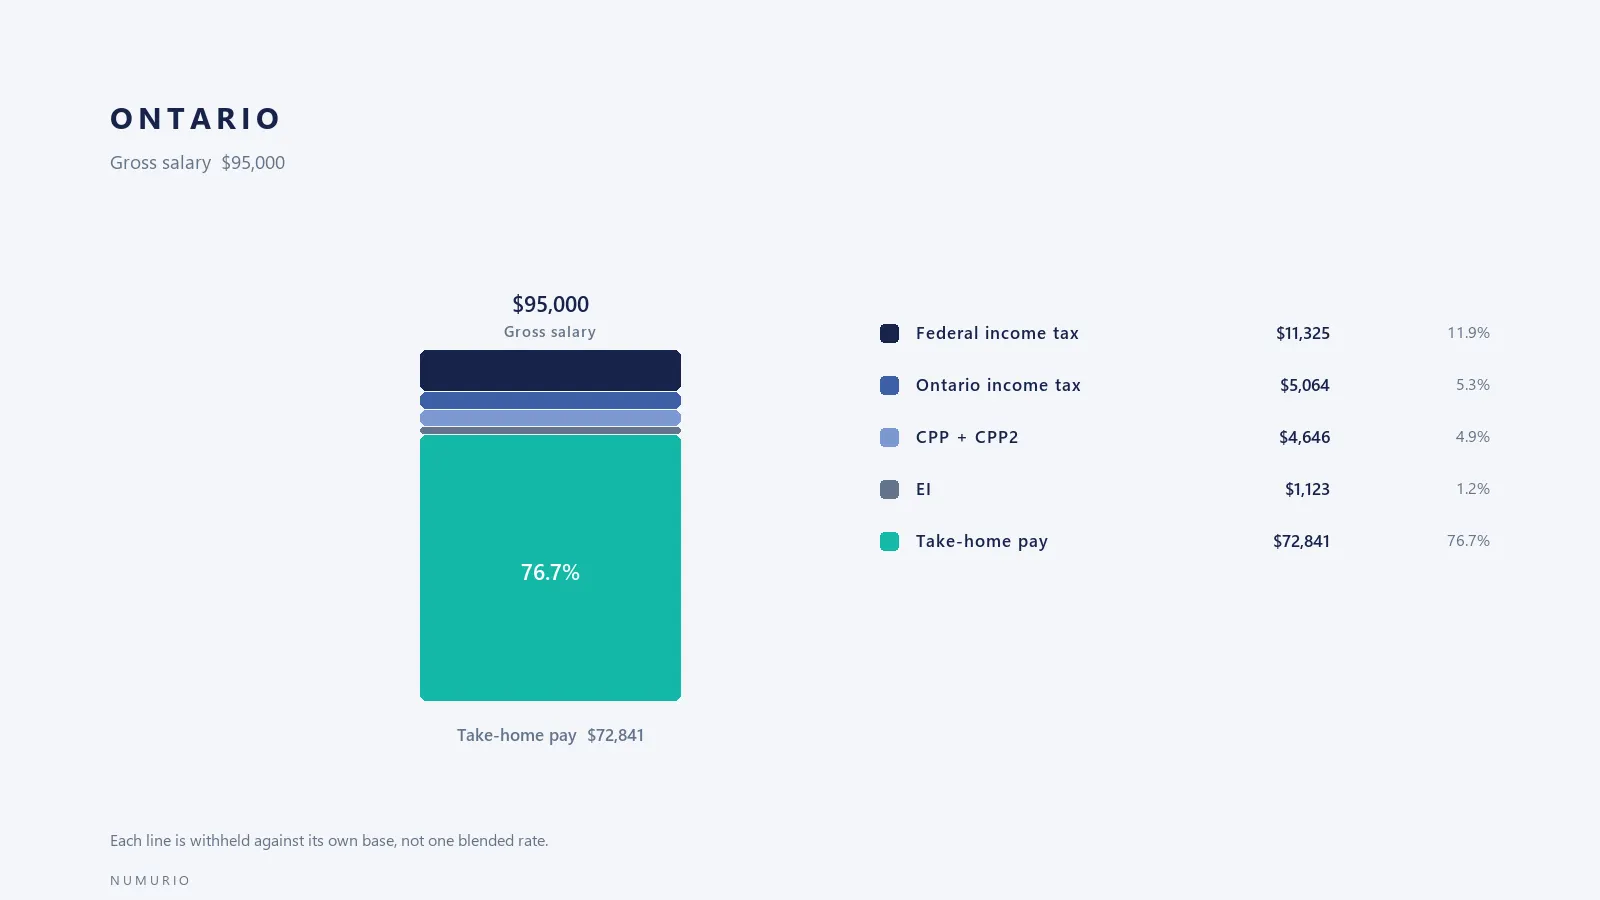
$95,000 gross in Ontario leaves $72,841 a year — $6,070 a month, $2,802 biweekly, or $1,401 weekly if your employer runs those cycles. The salary is above the first CPP ceiling, so it pays CPP2 on top of CPP.
- Federal income tax$11,32511.9%
- Ontario income tax$5,0645.3%
- CPP + CPP2$4,6464.9%
- EI$1,1231.2%
- Take-home pay$72,84176.7%
Marginal rate on the next dollar: 29.6%. That is not the same number as the effective rate above — the effective rate is the average, the marginal is what a raise actually costs you.
Which ceilings this salary reaches
Canadian deductions do not run on one smooth rate — they trip over four thresholds, and once a line is capped it stops moving until the next year. Here is where $95,000 sits against each of them.
| Threshold | Status at $95,000 | What it means on the payslip |
|---|---|---|
| CPP basic exemption ends ($3,500) | passed | $4,230 of CPP is deducted, 5.95% of pay above the exemption. |
| CPP ceiling ($74,600) | capped | CPP stops at $4,230. Additional salary no longer increases the pension line. |
| CPP2 second ceiling ($85,000) | capped | CPP2 has reached its $416 maximum. Anything above $85,000 is free of it. |
| EI ceiling ($68,900) | capped | EI stops at $1,123; the premium no longer grows with salary. |
Where $95,000 sits in Ontario
Federal tax on this salary runs at 21%, in band 2 of 5. The next federal band begins at $181,440, so $92,210 of taxable income still fits below it — and that slice is taxed at 21% rather than the 26% that starts above it.
Ontario taxes this income at 9%, in its band 2 of 5. Its next threshold is $150,000, $60,770 above this salary's taxable income. Federal and provincial brackets do not line up, which is why the combined marginal rate here (29.6%) is not simply the sum of two published rates.
Three separate ceilings govern the deductions, and they trip at different salaries. CPP is capped at $4,230 — the 5.95% rate stopped applying above $74,600. CPP2 has reached its own maximum of $416; earnings above $85,000 carry no second-tier pension charge. EI is capped too: the premium stops at $1,123 once insurable earnings pass $68,900. Because they are separate lines rather than one, the take-home curve has kinks at different incomes, not a single break point.
The combined marginal rate is 29.6% while the average rate on the whole salary is 23.3% — a gap of 6.3%. The average is what the payslip shows; the marginal is what the next $1,000 is actually worth. On this salary that next $1,000 leaves $704, or 70.3% of the raise.
| Measure | At $95,000 | What it means |
|---|---|---|
| Taxable income | $89,230 | Gross $95,000 minus $5,770 of CPP, CPP2, EI |
| Federal band | 2 / 5 at 21% | $92,210 below the next federal threshold |
| Ontario band | 2 / 5 at 9% | $60,770 below the next provincial threshold |
| Marginal vs average | 29.6% / 23.3% | Take-home $72,841 a year |
The payslip in four cycles
Canadian payroll is commonly biweekly or semimonthly rather than monthly, which is why this table shows four cycles instead of two. Every column is annual arithmetic divided evenly — it is not what a specific pay period withholds, because payroll also carries year-to-date figures.
| Line | Year | Month | Biweekly | Week |
|---|---|---|---|---|
| Gross | $95,000 | $7,917 | $3,654 | $1,827 |
| CPP | −$4,230 | −$353 | −$163 | −$81 |
| CPP2 | −$416 | −$35 | −$16 | −$8 |
| EI | −$1,123 | −$94 | −$43 | −$22 |
| Federal tax | −$11,325 | −$944 | −$436 | −$218 |
| Ontario tax | −$5,064 | −$422 | −$195 | −$97 |
| Take-home | $72,841 | $6,070 | $2,802 | $1,401 |
Taxable pay here is $89,230 — the gross salary minus CPP, CPP2, EI. Both the federal and the Ontario schedules are charged on that figure, which is why the tax lines are smaller than the headline rates applied to $95,000 would suggest.
What $10,000 either side does
A raise is not the same as a rate change. The table runs the neighbouring salary tiers through the same province so you can see how much of the difference actually arrives.
| Gross salary | Take-home | Change in take-home | Share of the raise kept |
|---|---|---|---|
| $85,000 | $65,806 | -$7,035 | 70.3% |
| $95,000 | $72,841 | — | — |
| $105,000 | $79,876 | $7,035 | 70.3% |
Read the province page for the rest
The Ontario page carries the two schedules, the thirteen-jurisdiction comparison and the credit arithmetic behind these numbers. This page deliberately keeps to what is specific to $95,000: which ceilings it hits and what the neighbouring salaries look like.
All about take-home pay in Ontario →
Same salary in other jurisdictions
At C$95,000 Ontario keeps C$72,841 and British Columbia keeps C$73,238 — C$397 a year, and every dollar of it is provincial tax
Ontario and British Columbia charge the same CPP, the same CPP2 and the same EI on the same C$95,000, and the federal bill is identical too, because federal brackets do not vary by province. Nothing separates the two provinces except the provincial tax line — so the C$397.09 difference between them is exactly that line, not an estimate of living costs dressed up as a tax figure.
C$95,000 gross, single filer, no RRSP or pension deduction, 2026. Federal tax is the same figure in both columns.
| Line | Ontario | British Columbia |
|---|---|---|
| Gross salary | C$95,000.00 | C$95,000.00 |
| CPP | −C$4,230.45 | −C$4,230.45 |
| CPP2 | −C$416.00 | −C$416.00 |
| EI | −C$1,123.07 | −C$1,123.07 |
| Federal income tax | −C$11,324.88 | −C$11,324.88 |
| Provincial income tax | −C$5,064.20 | −C$4,667.11 |
| Take-home, per year | C$72,841.41 | C$73,238.50 |
| Take-home, per month | C$6,070.12 | C$6,103.21 |
| Take-home, per two weeks | C$2,801.59 | C$2,816.87 |
| Share of gross deducted | 23.33% | 22.91% |
The three payroll contributions have already stopped growing at C$95,000
CPP stops at C$74,600 of pensionable earnings, CPP2 stops at C$85,000, and EI stops at C$68,900 — all three ceilings sit below C$95,000. So C$4,230.45 + C$416.00 + C$1,123.07 = C$5,769.52 is the maximum an employee can pay in 2026, and it is the same number in every province. Raising the salary from C$95,000 to C$100,000 adds nothing to any of those three lines; only income tax moves.
That matters for how this gap should be read. The C$397.09 between the two provinces is not a percentage of anything that compounds — it is one line of one tax return, and it stays roughly that size until salaries climb far enough to push either province into a higher band. As a monthly figure it is C$33.09, and as a two-week figure C$15.28. Anyone moving between the two provinces for the tax difference alone is making a decision on C$33 a month.
Alberta is the one province where the "low-tax" label does not hold at this salary
Same C$95,000, same CPP/CPP2/EI, same federal tax. Only the provincial tax line changes, so the ranking is decided by one row.
| Province | Provincial tax | Take-home per year |
|---|---|---|
| British Columbia | −C$4,667.11 | C$73,238.50 |
| Ontario | −C$5,064.20 | C$72,841.41 |
| Alberta | −C$5,506.13 | C$72,399.48 |
Alberta is usually described as the low-tax province, and on sales tax it is: no provincial sales tax at all, which is a real and separate advantage. On income tax at C$95,000 it is the most expensive of the three. Its 8% band covers the first C$61,200 and 10% above that, so the whole salary is taxed at a rate that British Columbia does not reach until well past C$100,728. A flat-looking rate schedule can still produce a higher bill than a graduated one, and this salary level is where that shows up: Alberta pays C$839.02 more than British Columbia and C$441.93 more than Ontario.
Two things this page does not price. Quebec is not in the table, because its payroll side runs on QPP, QPP2 and QPIP with different ceilings and a federal abatement — the net figure there is not comparable line for line. And nothing here reflects what the money buys: housing, transit and sales tax differ far more between these provinces than the C$397 of income tax does.
- Is British Columbia really cheaper than Ontario at C$95,000?
- By C$397.09 a year, C$33.09 a month. That is the entire provincial tax difference at this salary; every other line — CPP, CPP2, EI and federal tax — is identical. At other salaries the gap moves, because both provinces use graduated bands with their own thresholds.
- Why is Alberta's income tax higher here if it has no sales tax?
- Those are different taxes. Alberta's 8% band runs to C$61,200 and 10% above it, while British Columbia taxes the same salary through 5.06% and 7.7% bands. A flat schedule is not automatically a cheaper one — at C$95,000 it produces C$5,506.13 against C$4,667.11. Alberta's advantage is on what you spend, not on what you earn.
Other salaries in Ontario
Questions about this salary
What is $95,000 a year per month after tax?
$6,070 a month in Ontario, or $2,802 biweekly. The annual figure is $72,841, after $4,646 of pension contributions, $1,123 of EI and $16,389 of income tax.
Does $95,000 reach the CPP ceiling?
Yes. CPP is capped at $4,230, so further salary does not add to it.
Is the tax on this salary really only 23.3%?
Yes, that is the average across the whole salary. The marginal rate is 29.6%, and the difference between those two numbers is the whole reason progressive tax feels lighter than the top rate suggests.
How does Quebec differ from this page?
Quebec is in the same dataset but on its own parameters: QPP and QPIP replace CPP and EI, the Quebec EI rate is lower, and a 16.5% abatement cuts the federal tax. Its numbers are therefore not directly comparable with this page's CPP and EI lines — the Quebec page shows its own payslip.